

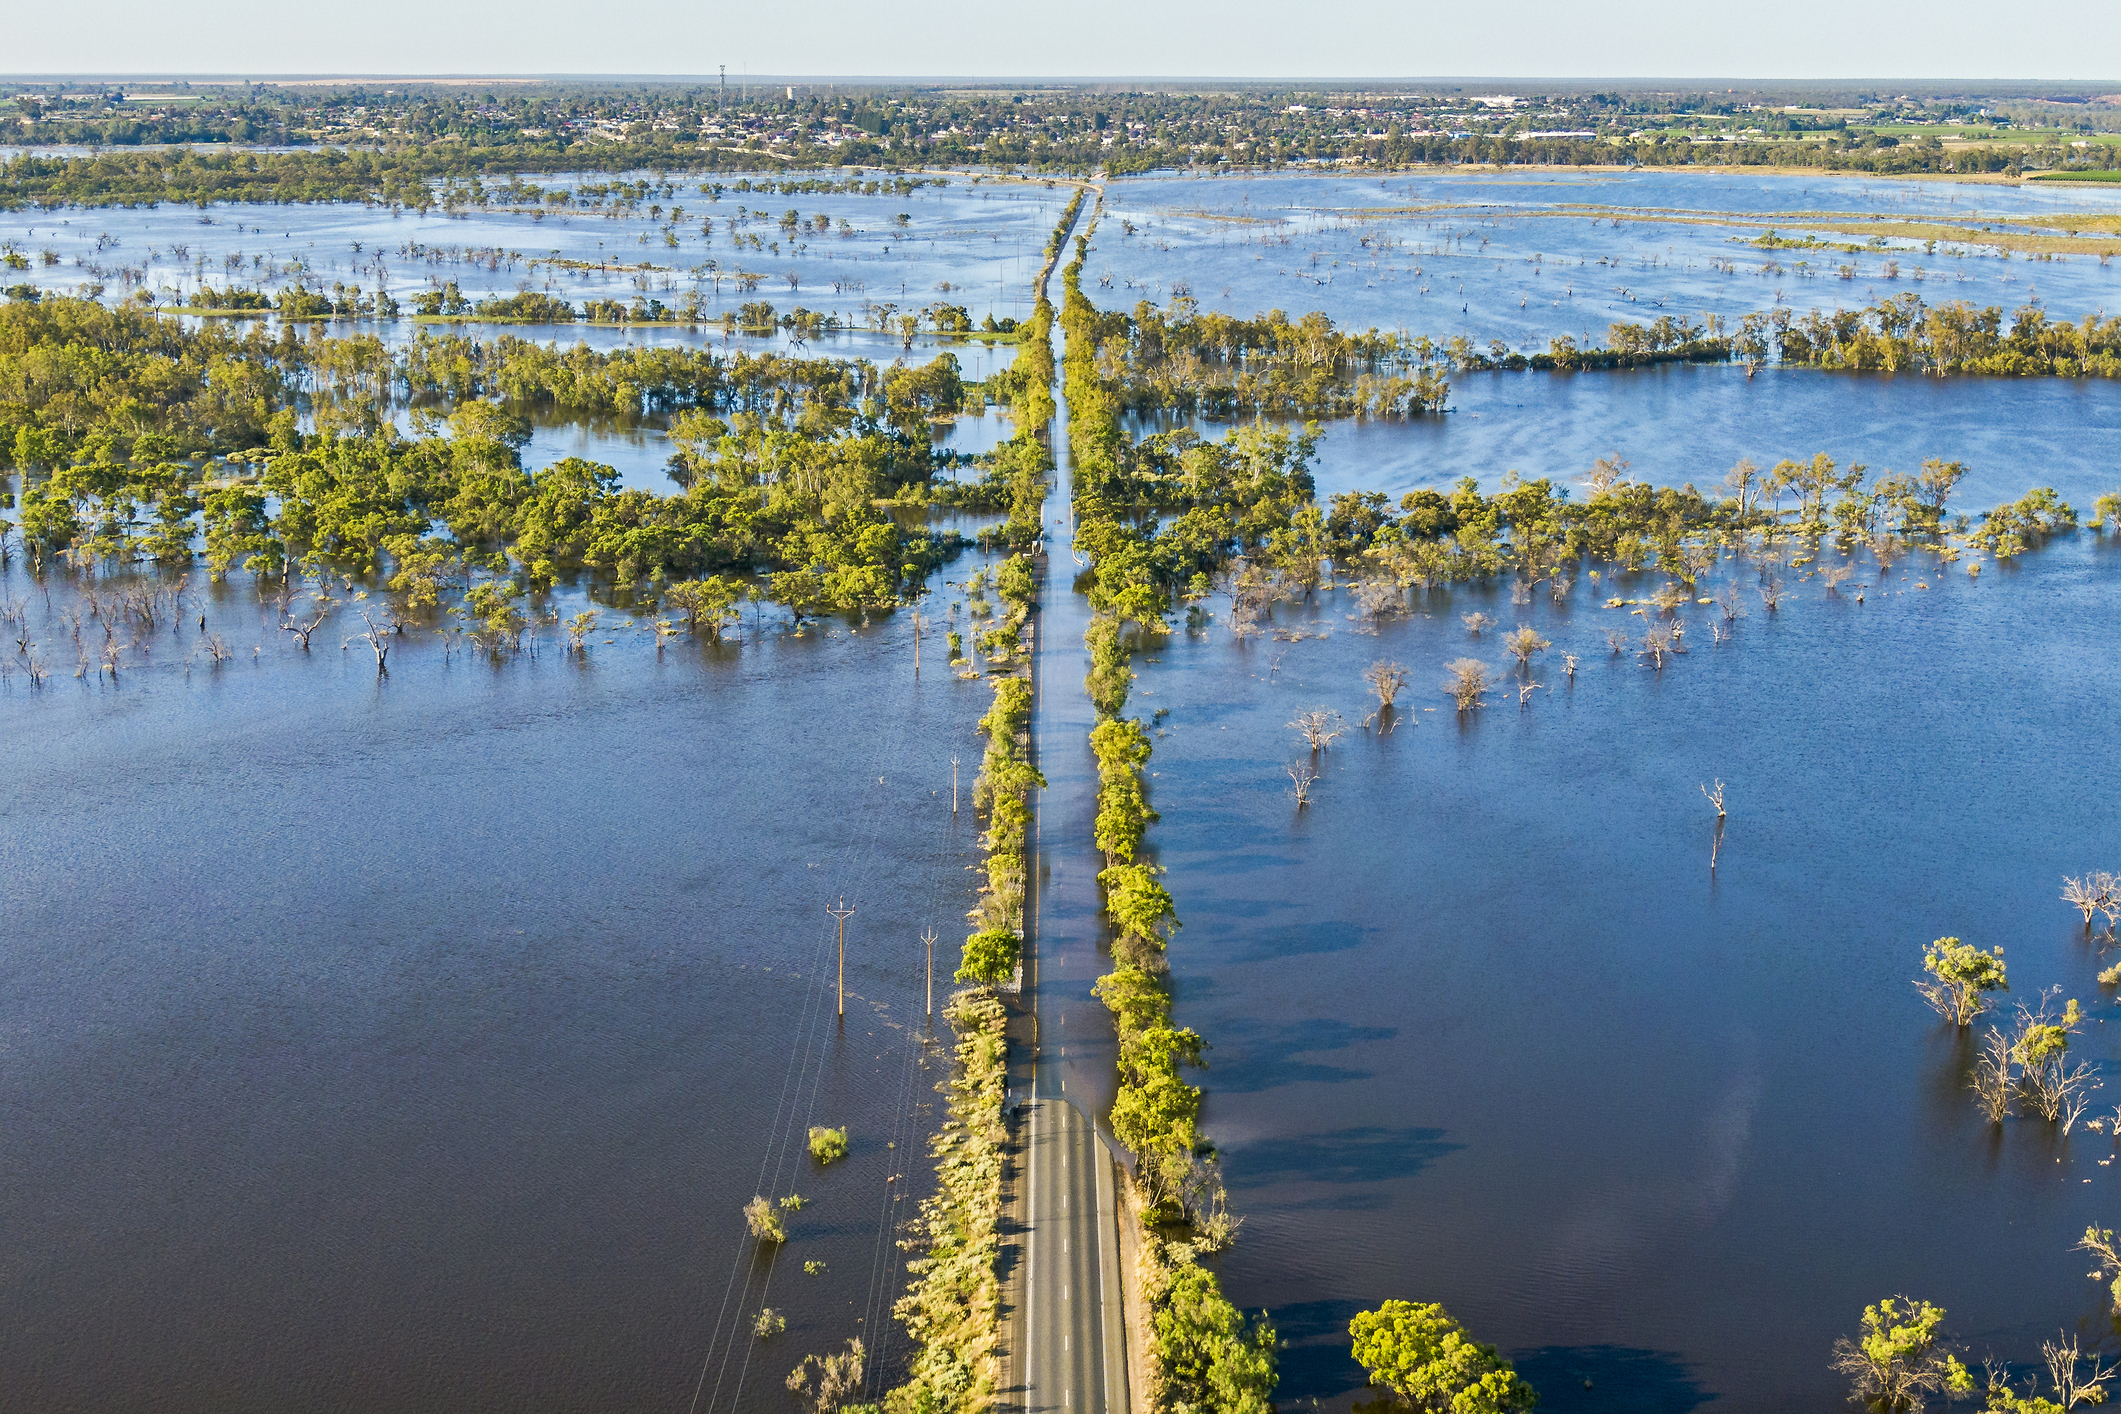
When floods spread across large areas, the resulting economic loss can be challenging for insurers to measure. Water that lingers for days does more than damage the homes and other structures in its path. Transportation halts, businesses lose customers, and supply chains break down. These ripple effects are often the far larger share of the loss, yet are particularly hard to quantify.
The measurement tools most insurers rely on today were originally designed to track rain and river levels, but have since been repurposed to estimate losses from widespread flooding. The problem is that damages from widespread flooding are determined by many more factors: how well an area drains, how low it sits, or how long the water sticks around. Rainfall totals and river levels don’t capture any of that.
Many of the flood measurement tools used in the parametric insurance market today have been borrowed for a job they weren’t designed to do. Here are four common approaches, what they do well, and where they fall short.
Point Sensors (One STtick, Or a Handful)
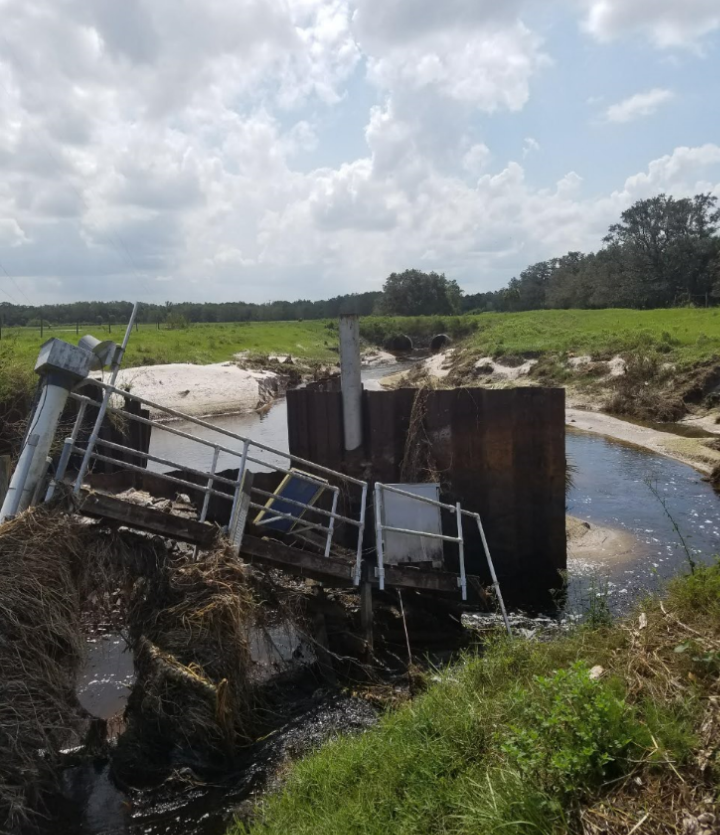
Starting with the most intuitive option, point sensors have an obvious appeal: a sensor reports an observed water depth at the exact spot where it’s installed.
The problem is that single points cannot reliably cover a large area. A single sensor only covers the asset directly below it. Five sensors don’t cover a region; they cover five points. And while the technology is well-suited to measuring one place precisely, keeping a network of many sensors running across large areas gets complicated - each one has to be installed, calibrated, maintained, and powered.
Sensor readings are also very sensitive to what is around the sensor itself, especially when things unexpectedly change. New roads and drainage projects can divert water toward or away from sensors, changing their readings drastically. Even something as random, yet common, as a fallen tree or another object blocking water could affect depth measurement and alter the result, with big implications for insurance policies they trigger.
A second, less visible problem with point sensors is lack of history. Insurers set the price of a policy using years of historical data. But a newly installed sensor has no historical record at that location, so the device deciding whether a policy pays out is working from different information than the data used to price it. That is the basic risk baked into the technology, before the ink is even dry.
Rainfall Measurements
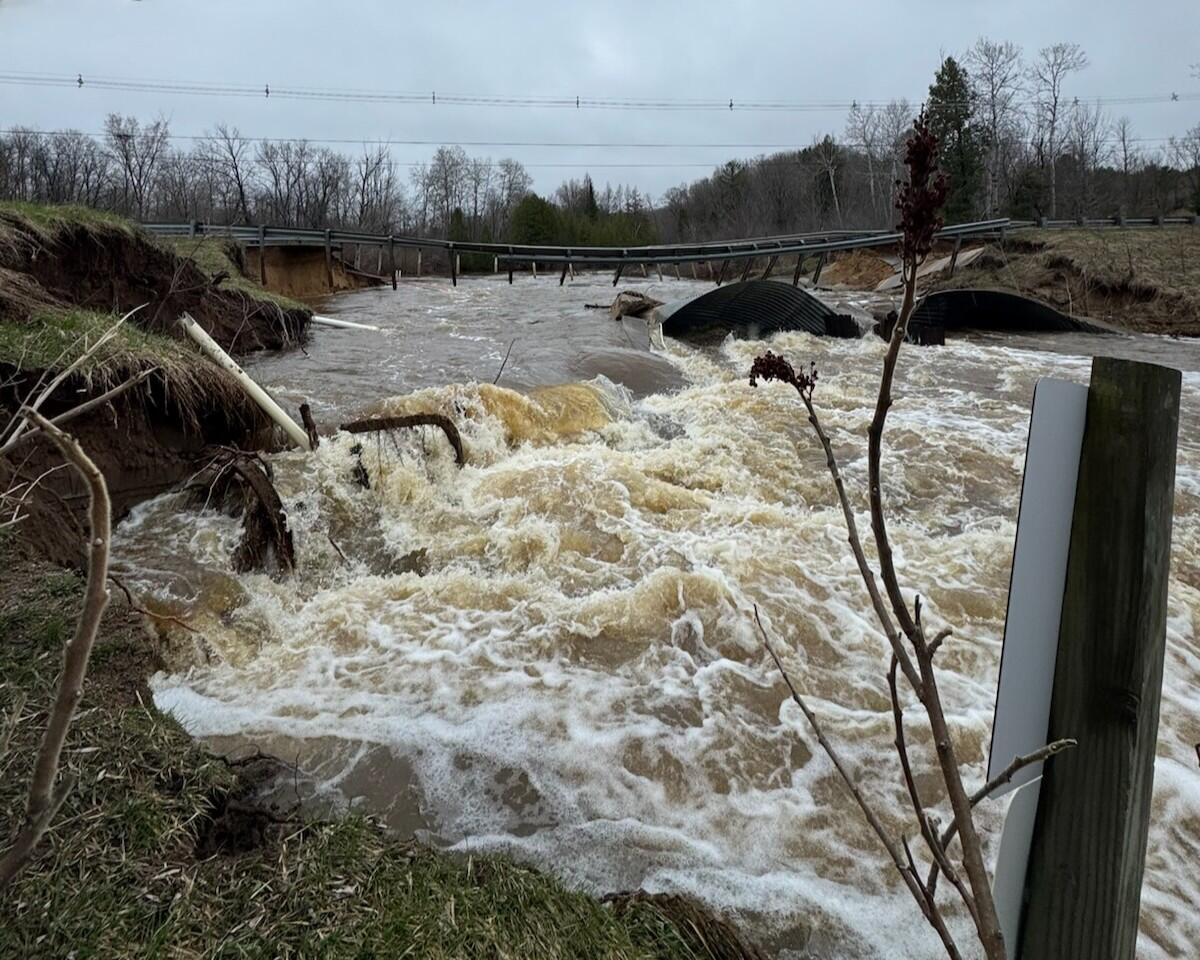
Rainfall is the most intuitive proxy for flooding: when a storm dumps massive amounts of water, floods follow. However, using rainfall totals as a standalone trigger for flood damage frequently falls short because rainfall measurements carry massive blind spots, and rainfall alone does not dictate where water accumulates.
Rainfall data leaves blindspots. Open precipitation datasets routinely miss or miscalculate extreme rainfall, whether they’re derived from ground sensors, spaceborne instruments, or atmospheric models:
- Rain Gauges (Point vs. Spatial Mismatch): Gauges provide accurate local readings, but they measure an area no larger than a dinner plate. Because gauge networks are sparse across much of the world, a severe convective storm can dump catastrophic rain just a few miles away without registering on the nearest sensor. Worse, extreme floods regularly knock ground stations offline or wash them away entirely, creating data blackouts when readings matter most.
- Satellites (Sensor Saturation & Latency): Satellite precipitation algorithms (like NASA’s IMERG) offer global coverage, but microwave and infrared sensors saturate during intense deluges—capping out and underestimating extreme tail-risk rainfall. To correct these errors, satellites rely on ground rain gauges; where gauge networks are sparse, satellite biases go uncorrected. Furthermore, fully calibrated, high-accuracy satellite products take up to four months to publish—far too slow for rapid parametric insurance payouts.
- Models & Reanalyses (Grid Dilution): Numerical weather models and reanalysis products (such as ERA5) divide the world into spatial grids. When a localized cloudburst dumps extreme rain over a single neighborhood, the model averages that volume across a 30km x 30km grid box—diluting a flood-triggering deluge into a moderate background rain rate.
Even if precipitation data were perfectly accurate and instantaneous, rainfall only measures what falls from the sky, leaving a massive disconnect with the hydrological reality of flooding. Flood damage depends on post-landing hydrology—where the water flows, how quickly soil saturates, how topography channels runoff, and what lies in the water's path.
Finally, many of the world's most damaging floods are not driven by local rainfall at all. Coastal storm surges, riverine overflows from distant upstream basins, rapid snowmelt, levee breaches, and clogged urban infrastructure regularly send water into streets without a single drop of local rain falling.
Global Hydrology Models
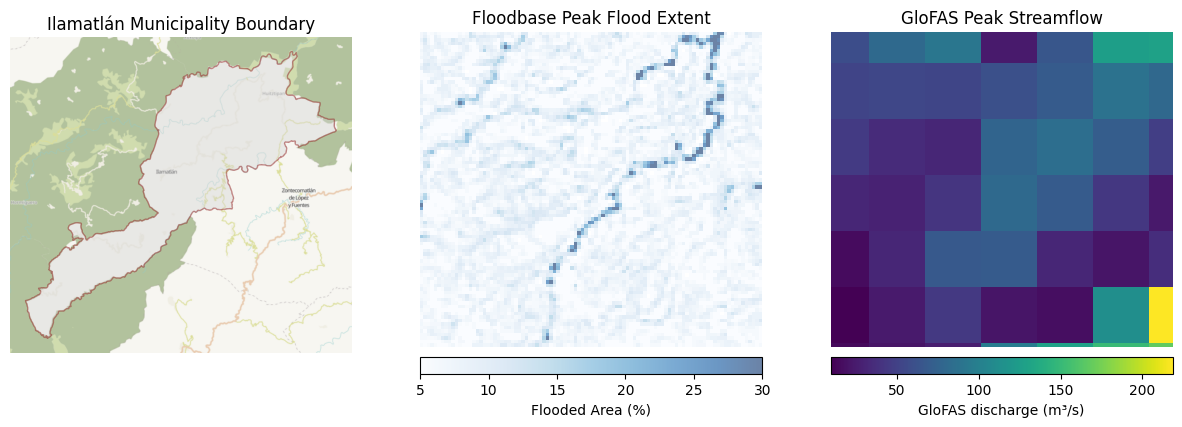
GloFAS (the Global Flood Awareness System), run by the European Commission and ECMWF, is a global model that estimates how much water is flowing through the world’s rivers. It takes rainfall, calculates how much runs off into rivers, and models how that water runs downstream. It does this on a roughly 5-kilometer grid, which means it is not very precise - some towns aren’t even 5-kilometers wide. But it was built for a specific job: early warning that an abnormal amount of water is on its way. For giving a region a few days’ notice to prepare and evacuate, it does that job well.
But the same things that make it good for early warning make it a poor tool for measuring flood loss, for two reasons.
First, GloFAS doesn’t watch floods. It calculates them from rainfall, so it’s only as good as its rainfall data, and that data misses the storms that matter. The worst floods usually come from intense rain concentrated in a small area; imagine a thunderstorm that dumps a foot of water on a few square miles in a few hours. But the rain data behind GloFAS sees the world in big chunks tens of miles across, and when intense rain falls on a small area, averaging it across those big chunks can make it look like ordinary, moderate rain. In these cases, the model never sees the storm, so it never predicts the flood.
The results bear this out: when researchers tested how often these tools correctly caught extreme floods, GloFAS caught about 1 in 100, and Google’s comparable system about 6 in 100. And those tests used the best-case historical rainfall. In a live event, the data is rougher still, so real-world performance is worse, not better.
Second, and more fundamental: water in a river doesn’t equate to damage on the ground. GloFAS tells you the volume of water flowing past a point in a river, called discharge, and if that volume is abnormally high. But the same amount of water can mean nothing or everything. If it stays in the channel, there’s no loss. If it spills over the levee toward open farmland, still little loss. If it spills over the other side into a neighborhood, it’s a catastrophe. The flow number reads exactly the same in all three.
Adding a stream gauge helps with the first problem because it measures real water levels and sharpens the volume estimate. But it does nothing for the second: a better number for water at one point is still not a measure of damage across an area.
Direct Observation from Satellite Radar (SAR)
SAR is a satellite radar that sends down its own pulses and measures what bounces back, so it works at night and sees through clouds. That is a real advantage, because floods happen in exactly the dark, cloudy conditions that blind ordinary satellite cameras. And unlike GloFAS, SAR doesn’t calculate a flood from rainfall. It observes where the water actually is. That makes it the best of these four for emergency response, when a team needs a map of what is underwater right now.
But it has gaps in both space and time that matter for parametric insurance.
The first is a tradeoff between detail and cost. A radar image sharp enough to see individual buildings covers only a small patch of ground. So getting building-level detail across a whole city, or across assets spread over a region, takes many separate passes, and each one costs money.
The second is that cities confuse it. SAR spots flooding because flood water is calm, smooth, and shows up dark in the image. The problem is that other things look dark too. Tall buildings cast shadows that mimic standing water, and smooth surfaces like wide roads and empty parking lots also read as dark. So in the dense, built-up places where the most insured value sits, it is hard to tell real flooding from look-alikes. Dense urban environments can also cause radar signals to bounce around buildings, preventing a reliable sensor reading to show where water is on the ground and instead sending noisy signals back to the sensor.
The third is timing. A satellite only passes over a given spot every so often, but a flood can rise and drain within hours. If nothing is overhead while the water peaks, that peak goes unrecorded and you cannot capture it after the fact.
The fourth is history, and it is the one that matters most for policy pricing. These radar satellites are recent, so there are only a few years of observation behind them, far too short to estimate how often a payout-sized flood happens. So services that use SAR pay out on what the radar picks up today, but have to price the policy on a different model built from longer-running data sources. Pricing on one dataset and paying out on another opens a gap between them, which is the exact basis risk parametric insurance is meant to remove.
A Better Way to Measure a Large-Area Flood
A flood proxy that holds up for large-area loss has to do four things at once.
First, it has to measure the thing that actually causes damage: flood water on the ground, not the rain falling from the sky, not the volume of water in a river, but where the water spreads and what it covers. Floodbase uses AI to fuse satellite, rainfall data, stream gauges, and hydrological model data into a single, near-real-time map of where water is when it should not be. We do this at the scale of cities, counties, regions, and whole countries.
Second, the measurement of the flooded area must be for the entire area, not a point or set of points. Fundamentally, your assets cover an area, and your risks are not all tied to a point. While sensors make great inputs to a measurement, they’re not enough on their own. For example, an asset on a hill might not have any direct damage from flooding, but when the surrounding area is flooded, business stops, and economic damage still occurs.
Third, the reading must be timely and accurate. Waiting up to four months for an accurate IMERG Final reading is too long for businesses and governments that need to fund disaster cleanup or cover other immediate losses. Near real-time measurement of flooded area can happen rapidly and accurately by fusing multiple data sources with AI to directly observe flooded area.
Fourth, it has to use the same model to price the policy and to report the flood, so the carrier and the insured work from the same data when a claim is paid. With Floodbase, the model that prices the policy is the same model that reports the event. That closes the gap between what you underwrite and what you pay out, the basis risk parametric is meant to remove.
These four common flood proxies discussed here are useful for the jobs they were built for, but fall short of fulfilling the needs of parametric insurers. Measuring flood loss across a large area is a specialized job, and it requires technology built for it.


