
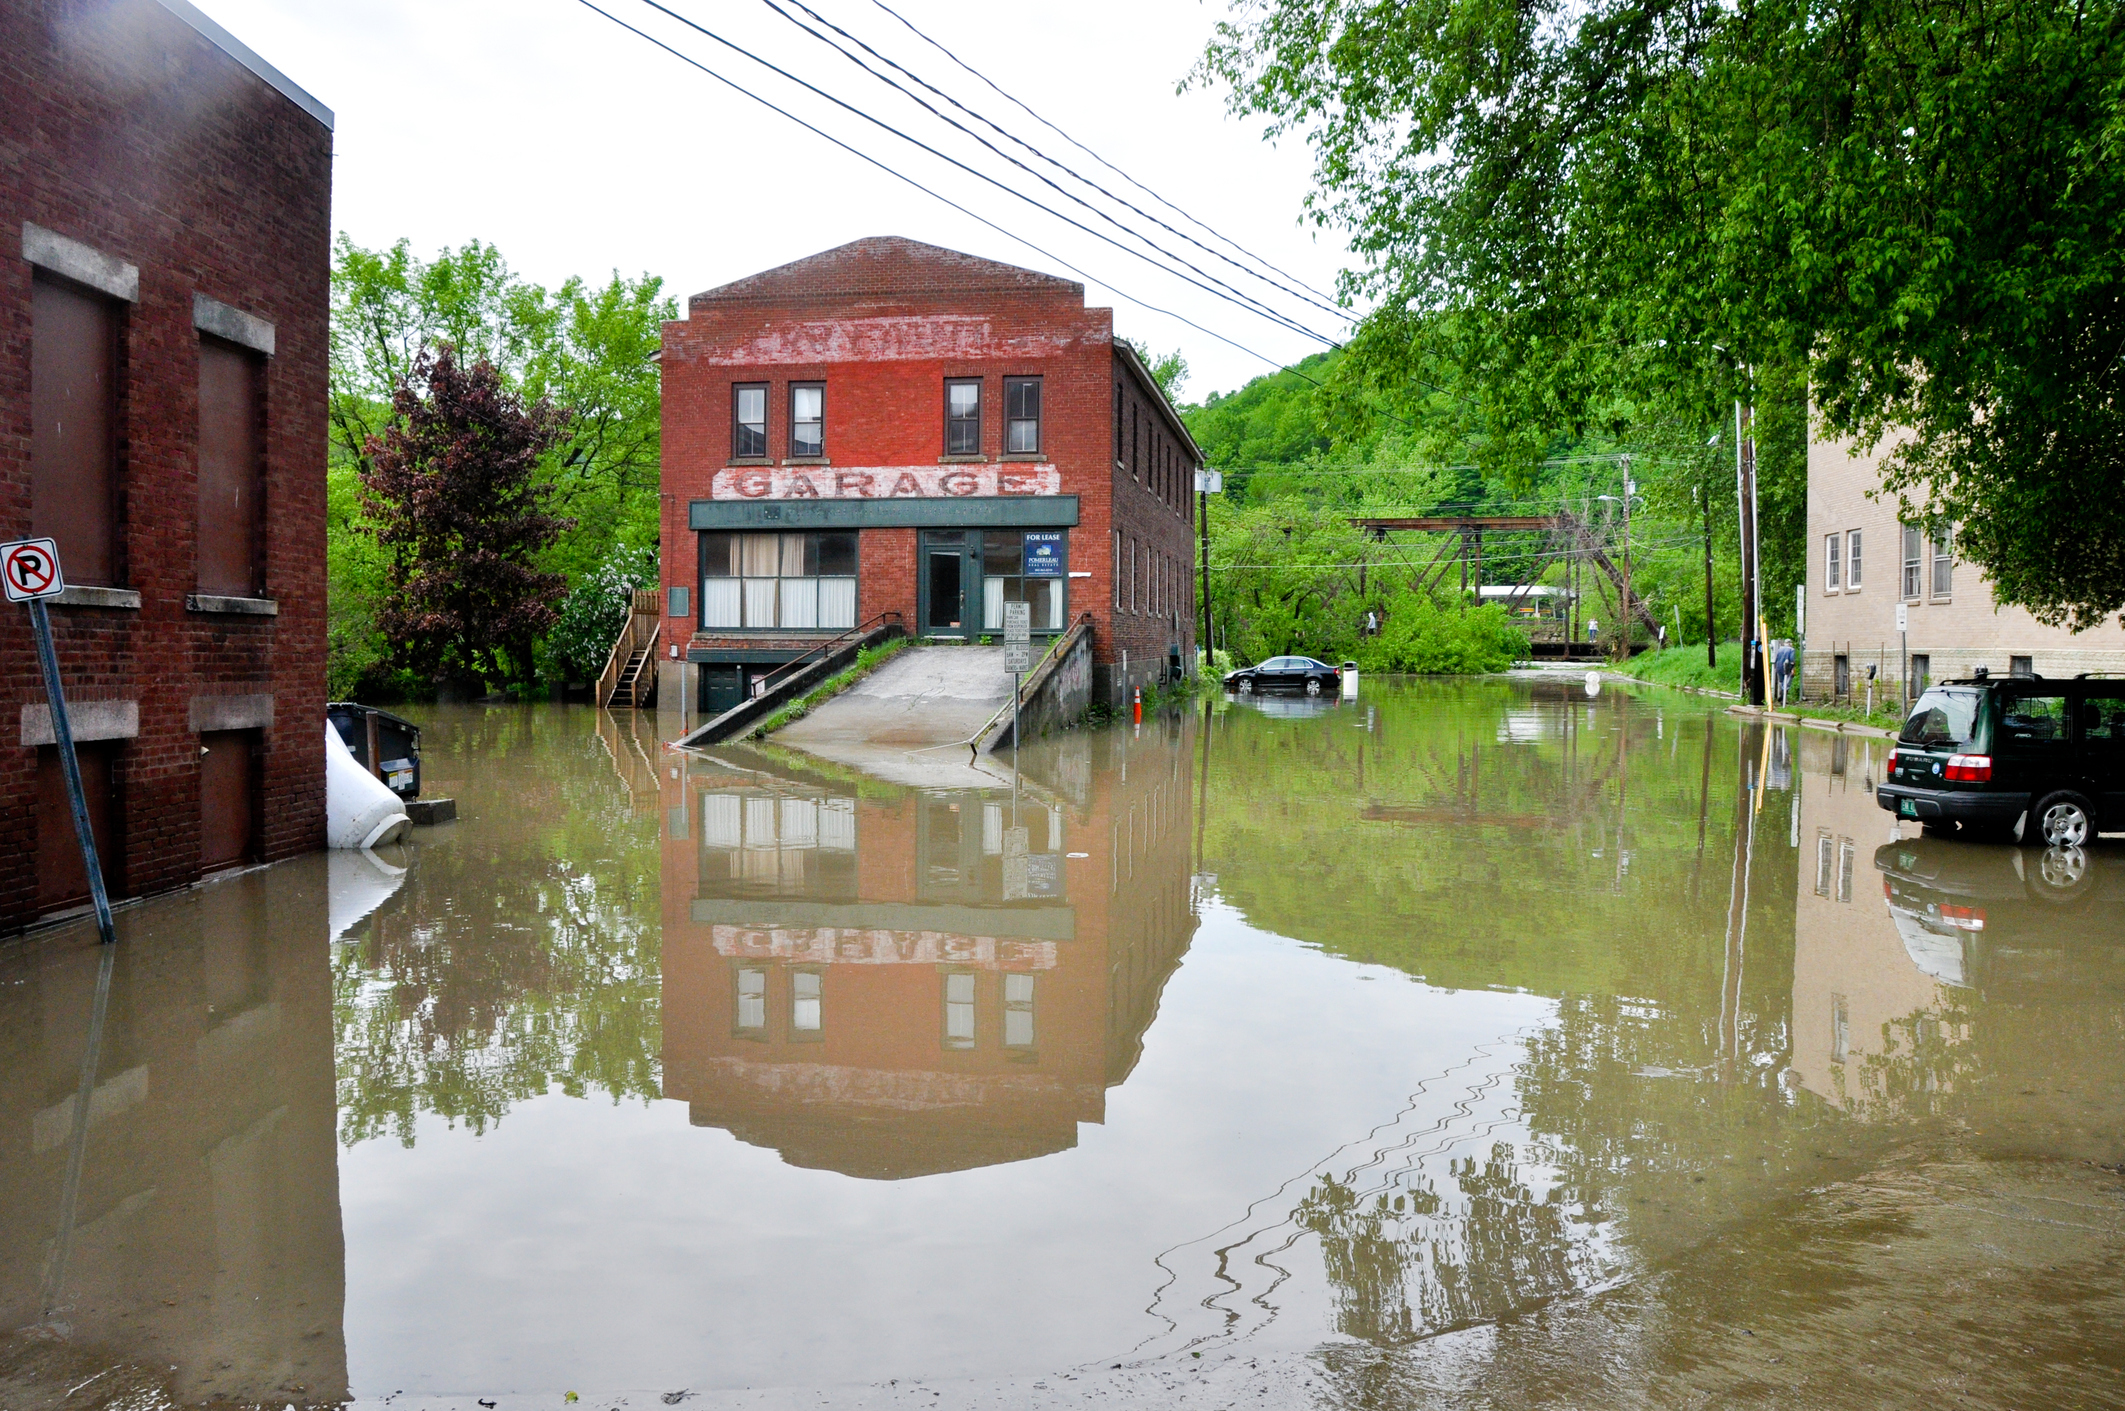
In the summer of 2023, catastrophic flooding inundated Vermont, submerging communities and causing historic financial devastation. As is the case in many modern flood disasters, the inundation was not caused solely by a single, unprecedented dump of water falling from the sky but a complex convergence of factors, including prior soil moisture, topography, and river capacity.
.gif)
Today, there is still a recurring and painful gap for communities that are left empty-handed after a catastrophic flood when their rainfall parametric threshold isn’t met. For years, the parametric insurance industry has relied on "excess rainfall" as a proxy for flood risk. Backed by recent academic research (Nayak et al 2025, Quintal et al 2025, Spekkers et al 2013), it is increasingly clear that excess rainfall alone is an incomplete proxy for actual flood damage. Relying exclusively on rain gauges or hydrologic and hydraulic models (that use physics to flow rainfall to a river and then overland) leaves out some of the factors that cause flooding.
High-resolution precipitation data (such as IMERG, GPM, or even NEXRAD in the US) serves as a highly effective secondary trigger in comprehensive risk modeling. Relying on coarse rainfall measurements as the sole proxy for inundation creates basis risk. Policyholders are left empty-handed when a community experiences a catastrophic flood without meeting the local rainfall threshold.
Measurement Limitations in Rainfall Data
The insurance industry sometimes utilizes gridded climate reanalysis data, such as ERA5, to evaluate risk and set thresholds to trigger policies. However, these datasets can struggle to capture the highly localized, intense bursts of rain that lead to catastrophic flash flooding.
Recent studies show that some popular climate datasets (like ERA5) lack the precipitation intensity and spatial coverage to identify local storm events. For instance, when researchers attempted to validate precipitation clusters at the native ERA5 resolution against historically observed storm events, the recall rate was surprisingly low, ranging from just 0.03 to 0.36 (a good recall rate would be at least 0.7, or catching 70% of events) (Quintal et al 2026). This poor performance implies that relying on such data likely underestimates the true number of storm events or misses their physical characteristics altogether. Coarse reanalysis data frequently miss smaller or short-lived storms that are not well resolved in ERA 5. A parametric trigger relying heavily on coarse gridded rainfall data can miss the local extreme events that drive flood losses.
The Process Gap: Rain Does Not Always Equal Flooding
Even if rainfall could be measured perfectly, it is only one ingredient in a flood. Soil saturation, topography, drainage capacity, and failing infrastructure influence where flood waters go; these are dynamics that a rain gauge simply cannot capture.
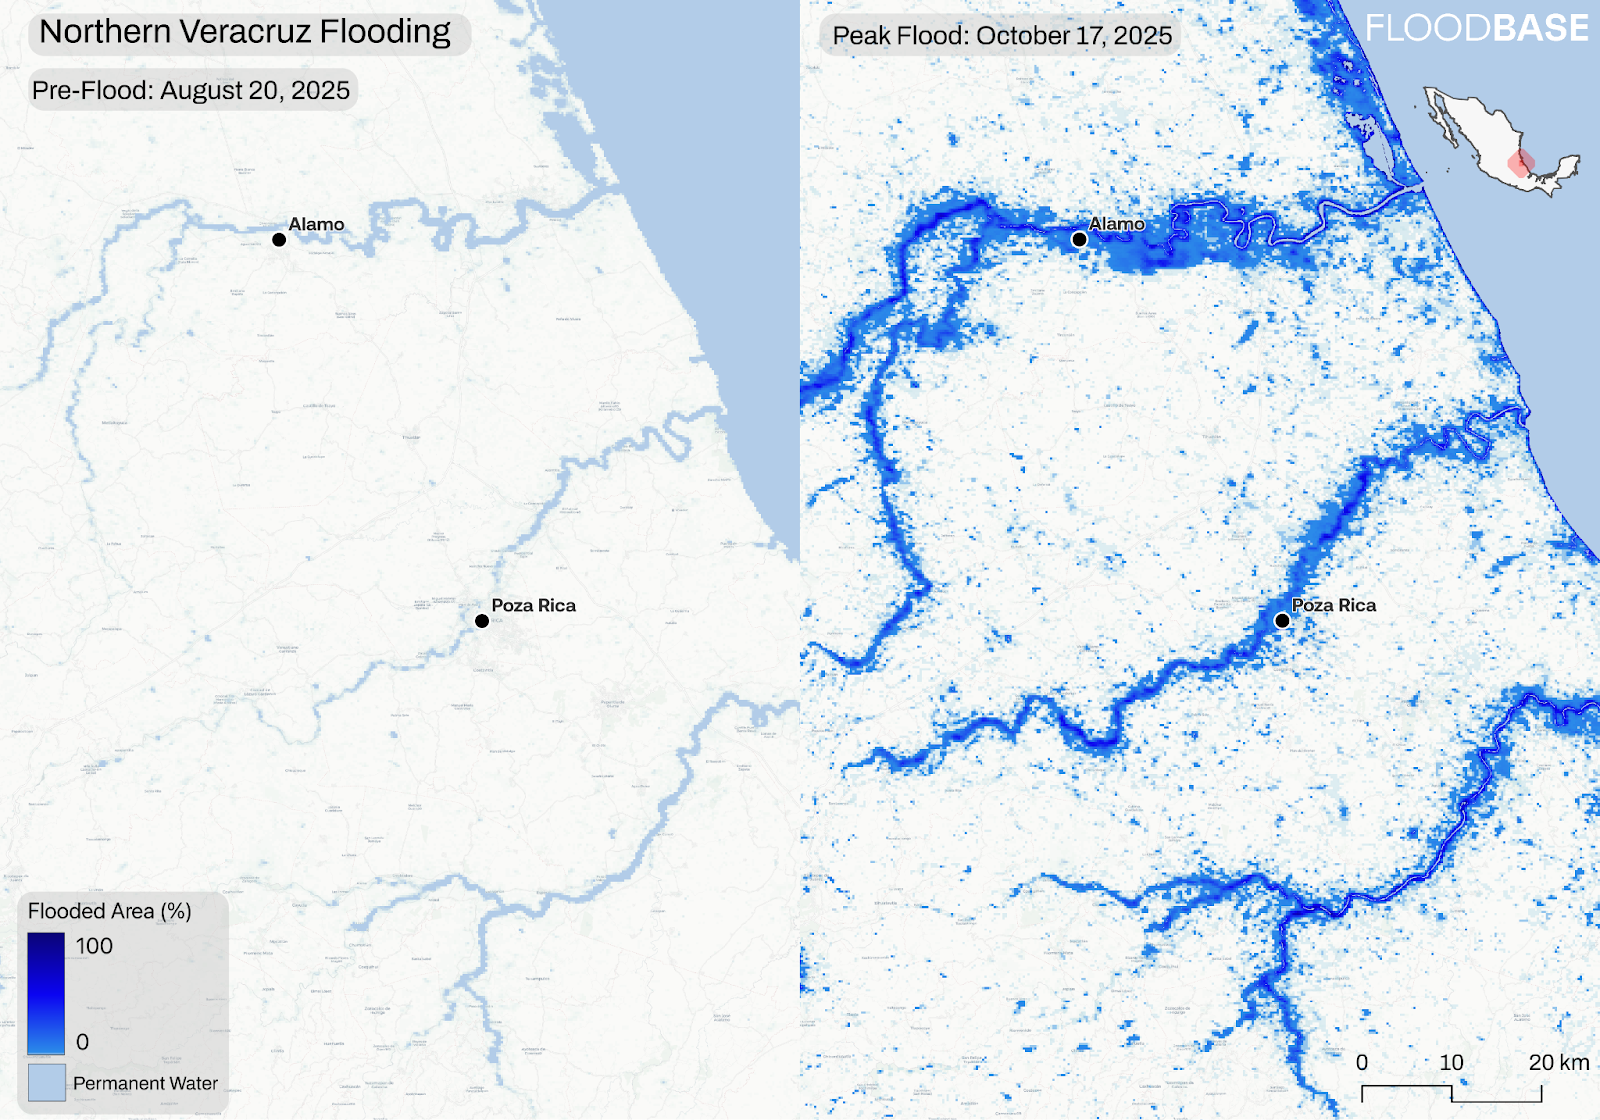
An analysis of water-related insurance damage claims in the Netherlands demonstrated that rainfall intensity accounts for a surprisingly low amount of property damage. The researchers found that rainfall intensity explained at most 34% of the variance for property damage and at most 30% for content damage (Spekkers et al 2013). An earlier study by the Dutch Association of Insurers (Ririassa and Hoen 2010) found even weaker correlations, with hourly rainfall explaining only 4% of content damage and 12% of property damage (Spekkers et al 2013). Basing a parametric flood payout solely on a rainfall trigger ignores the processes (and more proximate variables and triggers, like water on the ground) that cause property damage. For example, the 2025 Veracruz floods were caused by mild but constant rainfall over 2 months. Daily precipitation rates did not cross rainfall policy thresholds but still caused severe flooding and associated damages over time.
The Frequency Gap: The Myth of the "100-Year" Storm
The insurance sector anchors underwriting to the "100-year flood" threshold. But empirical data shows that financial devastation is driven by highly frequent, lower-intensity rainfall events. An analysis of millions of flood insurance records and FEMA disaster claims in the United States revealed that financial losses were associated with US floods occur with surprisingly low-return-period precipitation (Nayak et al 2025). The vast majority of financial flood losses are associated with low-intensity, high-frequency events relative to regional climatology.
Return periods for precipitation associated with insurance claims average under 5 years, with a median of 3.9 years. For household disaster aid and property buyouts, the return periods average under 20 years, with medians of 13.2 and 8.1 years, respectively. Meanwhile, the 100-year return period, which is the nominal criteria for mandated insurance, is associated with very few of the actual claims. A parametric policy designed to trigger only during a 100-year rainfall anomaly will completely miss the frequent, clustered events that are responsible for the vast bulk of economic flood losses (Nayak et al 2025).
Moving from Proxy to Intelligent Systems
Rainfall is a flawed metric for standalone flood insurance. It explains a minority of actual flood damage. To effectively transfer flood risk and eliminate basis risk, carriers and brokers must move away from relying exclusively on rainfall data. While advanced precipitation data makes an excellent backup trigger, the flood policies are likely better served by intelligent models that harness direct observation of inundation, among other inputs. Today, leading insurers, brokers, and reinsurers use Floodbase to structure parametric flood products with greater confidence. By replacing rainfall proxies with direct flood measurement from multiple data sources, Floodbase reduces basis risk and enables more transparent, reliable payouts—positioning it as the market standard for modern flood risk transfer.
References:
Quintal, Hunter, Antonia Sebastian, Greg Tierney, et al. 2026. “Evidence of Changing Storm Intensity, Duration and Frequency Derived from a Novel CONUS-Wide Database of Severe Storms Defined by Their Discrete Space Time Footprints.” Preprint, ESS Open Archive. https://doi.org/10.22541/essoar.176840682.23729518/v1.
Nayak, Adam, Pierre Gentine, and Upmanu Lall. 2025. “Financial Losses Associated with US Floods Occur with Surprisingly Frequent, Low Return Period Precipitation.” Preprint, Nature Water, March 26. https://doi.org/10.21203/rs.3.rs-6025742/v1.
Spekkers, M. H., M. Kok, F. H. L. R. Clemens, and J. A. E. Ten Veldhuis. 2013. “A Statistical Analysis of Insurance Damage Claims Related to Rainfall Extremes.” Hydrology and Earth System Sciences 17 (3): 913–22. https://doi.org/10.5194/hess-17-913-2013.
